This is an example page for the
jp_doodle
package.
jp_doodle
makes implementing special purpose interactive visualizations easy.
Quick references: Javascript API; Python API.
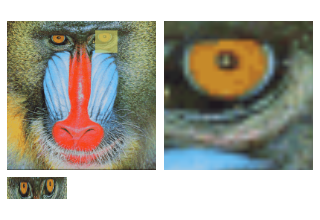
Miscellaneous Demos: Image detail viewer..
These example pages use stand alone Javascript, but the code used to implement them can be transliterated to Python and implemented using Jupyter widgets (modulo some subtleties).
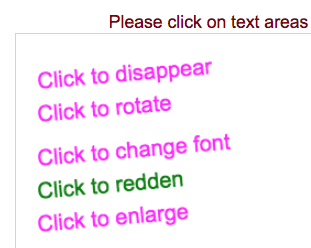
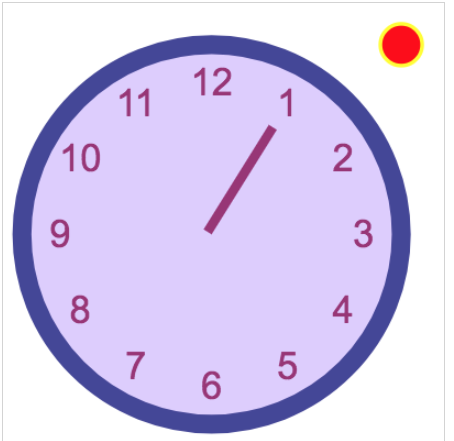
The jp_doodle package includes jQuery plugins to
make figures that can interact with mouse events and may be animated.
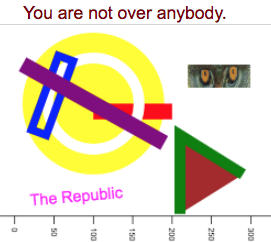
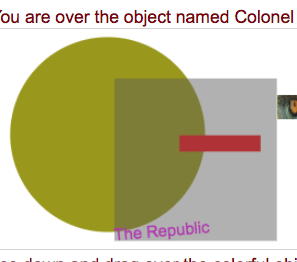
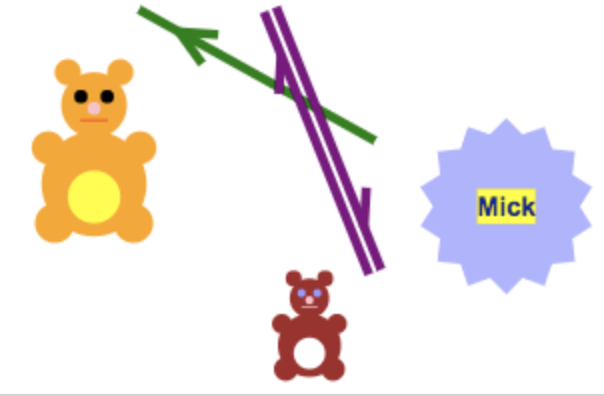
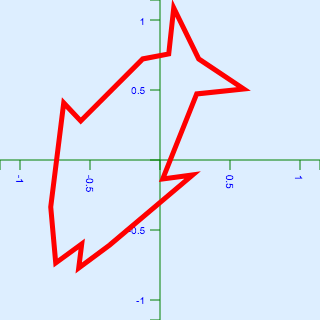
In this figure we draw a number of objects on a canvas to illustrate basic shapes. The figure also responds to mouse-over events. Move the mouse over the objects to see the "name" of the object undeneith the mouse.
The above figure illustrates the dual canvas component provided by the package The illustration attaches a dual canvas to a jQuery element and configures the canvas. It then draws a number of objects on the canvas and attaches a global event handler to the canvas.
The dual canvas is implemented using a JQuery plugin which has dependencies -- it requires JQuery to be available and the basic 2d canvas plugin from the package.
https://code.jquery.com/jquery-1.12.4.js
jp_doodle_js/canvas_2d_widget_helper.js
The dual canvas is implemented in jp_doodle_js/dual_canvas_helper.js