This is an example page for the
jp_doodle
package.
jp_doodle
makes implementing special purpose interactive visualizations easy.
Quick references: Javascript API; Python API.
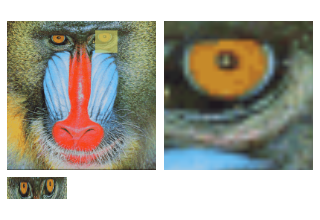
Miscellaneous Demos: Image detail viewer..
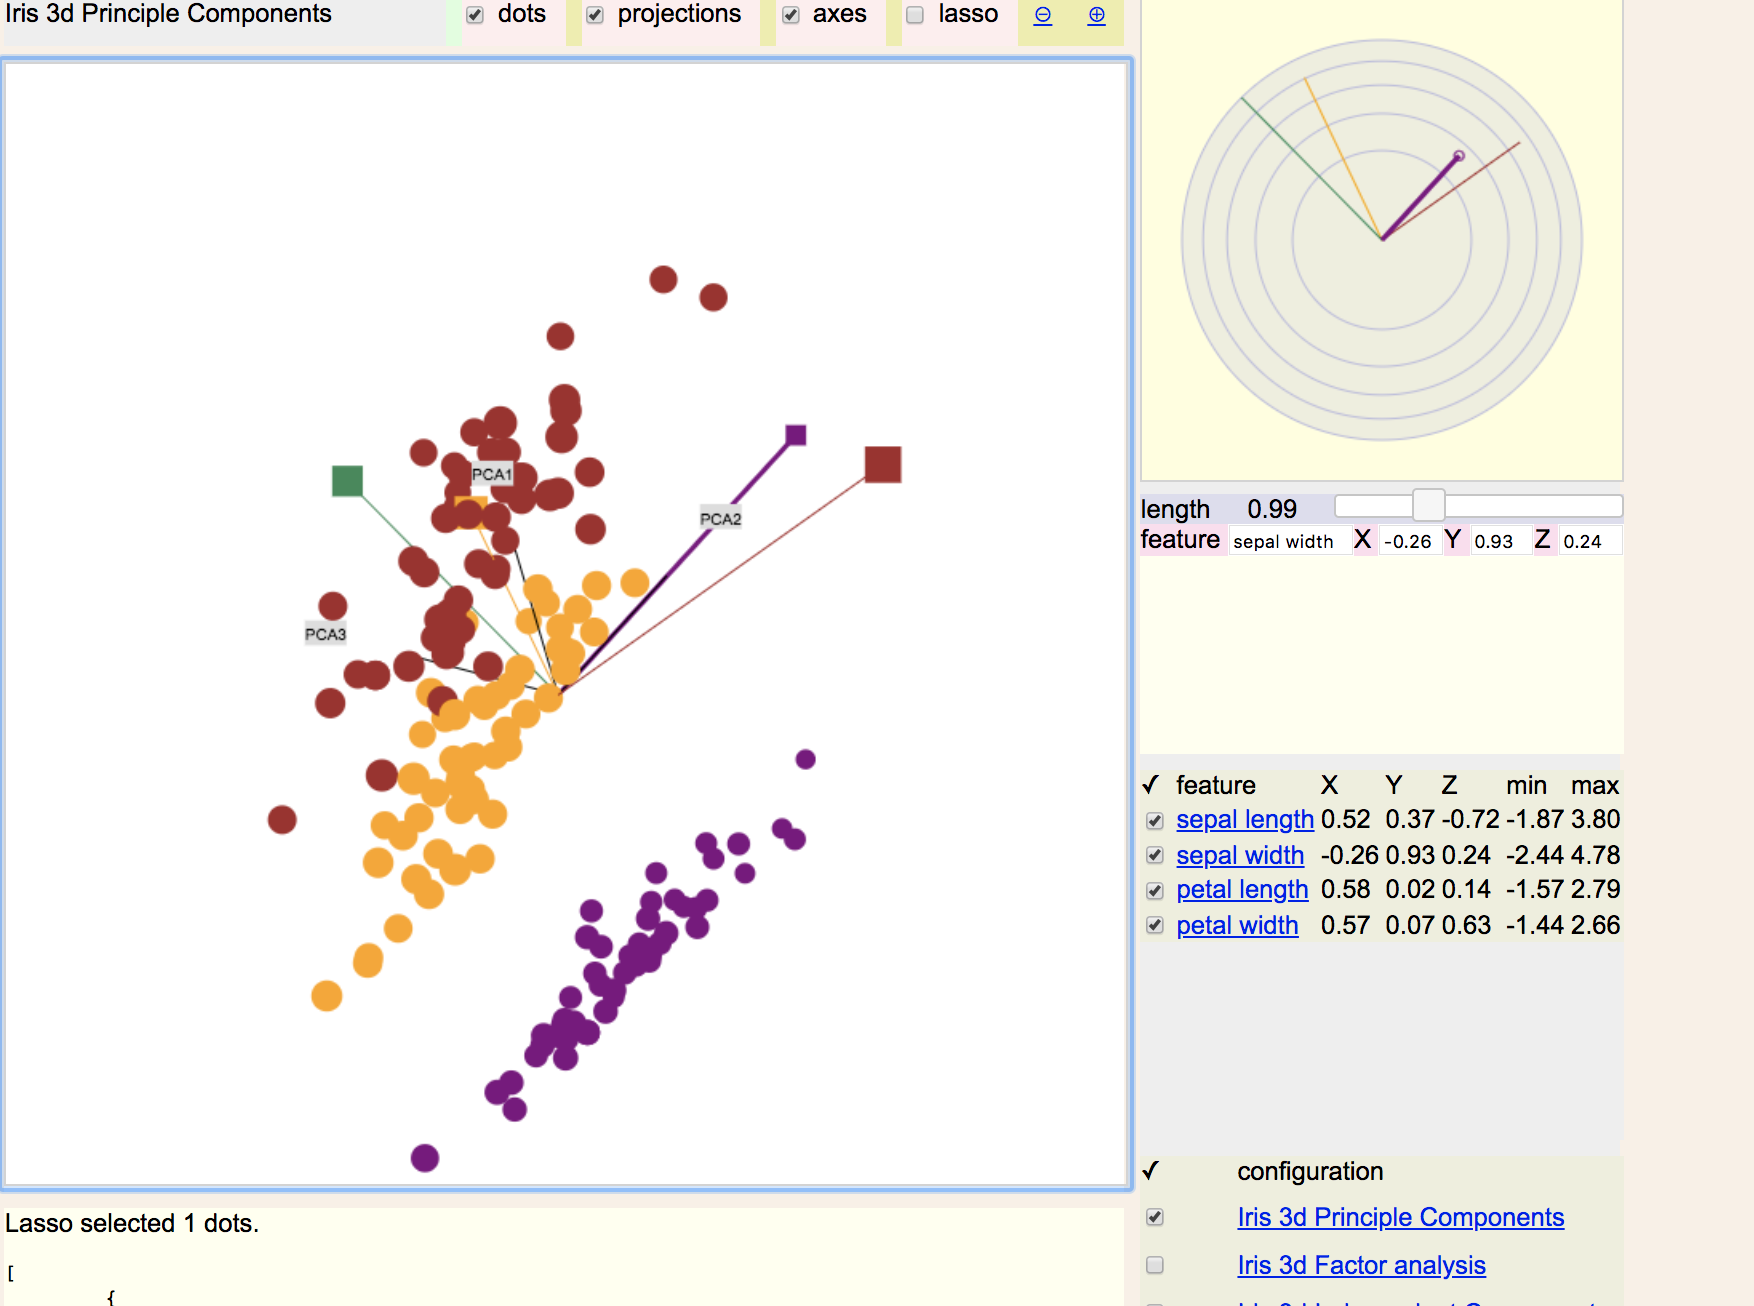
These example pages use stand alone Javascript, but the code used to implement them can be transliterated to Python and implemented using Jupyter widgets (modulo some subtleties).The multidimensional scatter plot widget allows interactive exploration of dimensionality reduction projections that project many features into three dimensional summaries.
The demonstration below shows the standard "iris" dataset projected from 4 dimensions into 3 dimensions using several projection methods.
The projection configurations were derived using scikit-learn.