This is an example page for the
jp_doodle
package.
jp_doodle
makes implementing special purpose interactive visualizations easy.
Quick references: Javascript API; Python API.
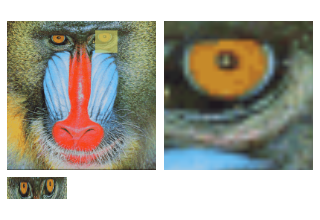
Miscellaneous Demos: Image detail viewer..
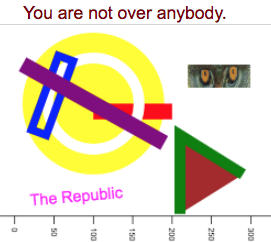
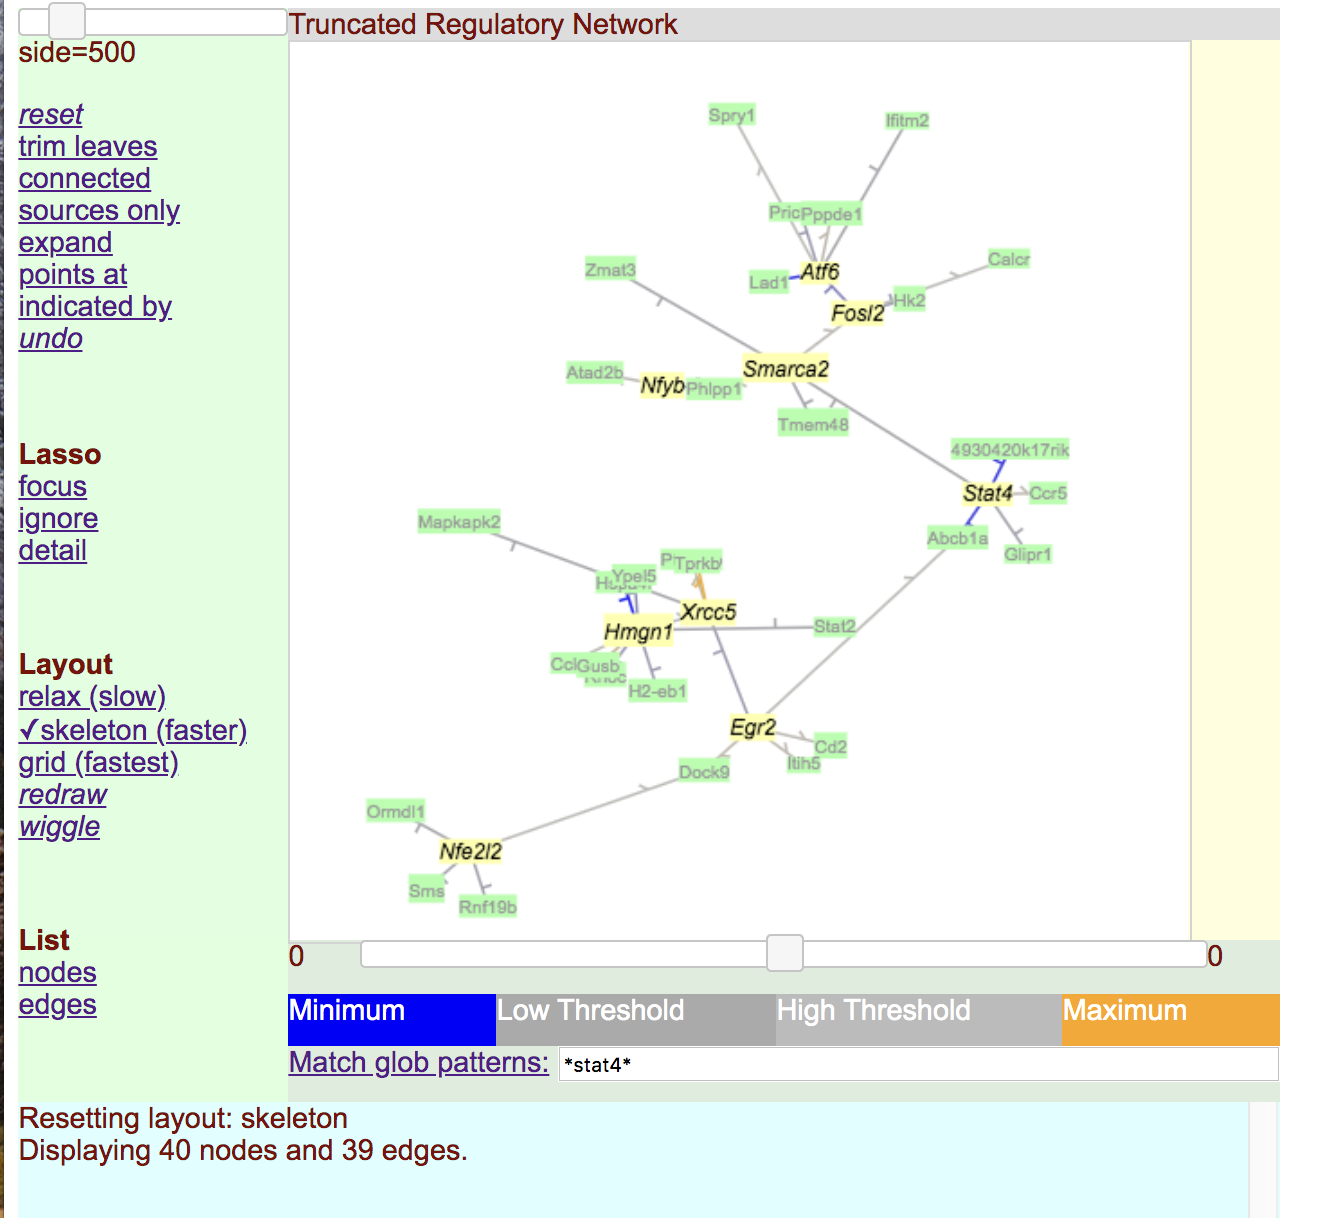
These example pages use stand alone Javascript, but the code used to implement them can be transliterated to Python and implemented using Jupyter widgets (modulo some subtleties).This illustration uses mouse events associated to the whole canvas to allow the user to drag elements using the mouse.
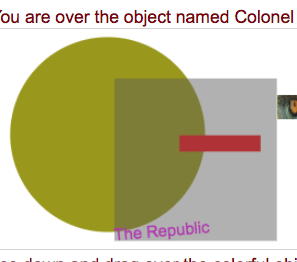
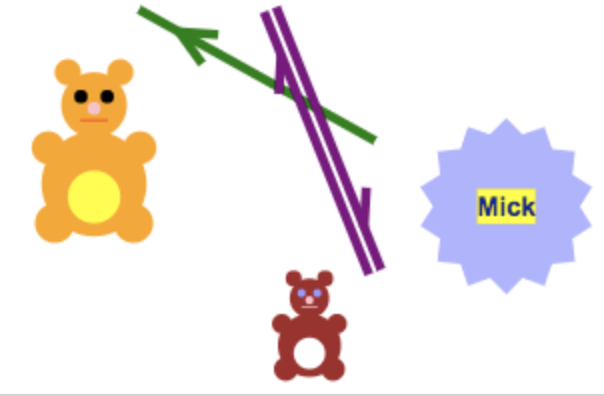
In this illustration you may move the named objects (everything colorful) by mousing down on the object and dragging it to a new location and then mousing up.
In this case the events are associated with the whole canvas (even though they sometimes use the name of the object under the mouse event).
Note that it is not possible to modify the semi-transparent grey square without clearing the whole canvas because the square was not given a name.