This is an example page for the
jp_doodle
package.
jp_doodle
makes implementing special purpose interactive visualizations easy.
Quick references: Javascript API; Python API.
Miscellaneous Demos: Image detail viewer..
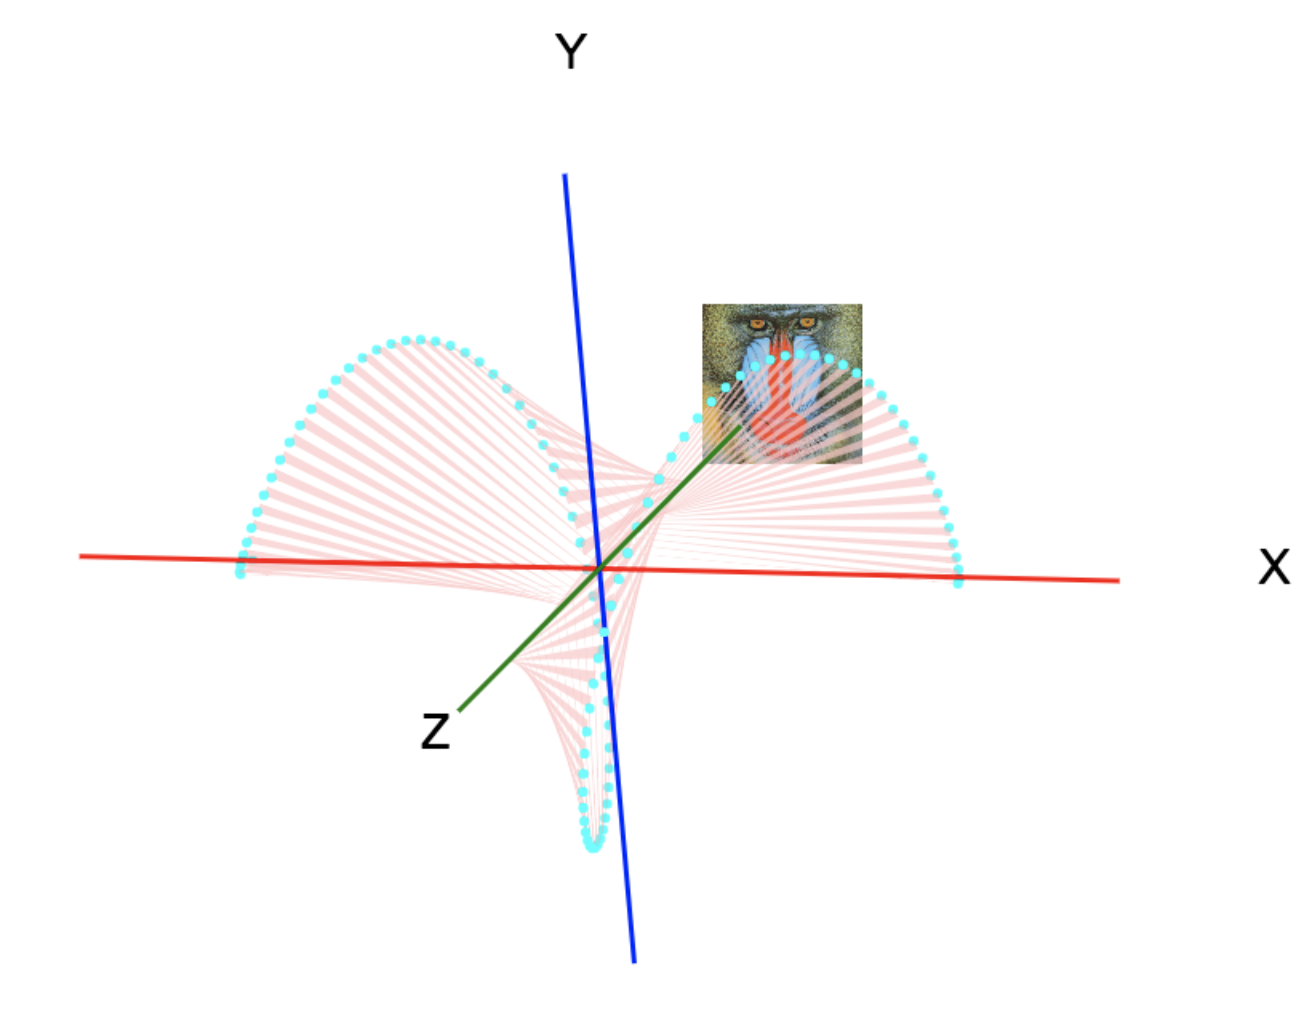
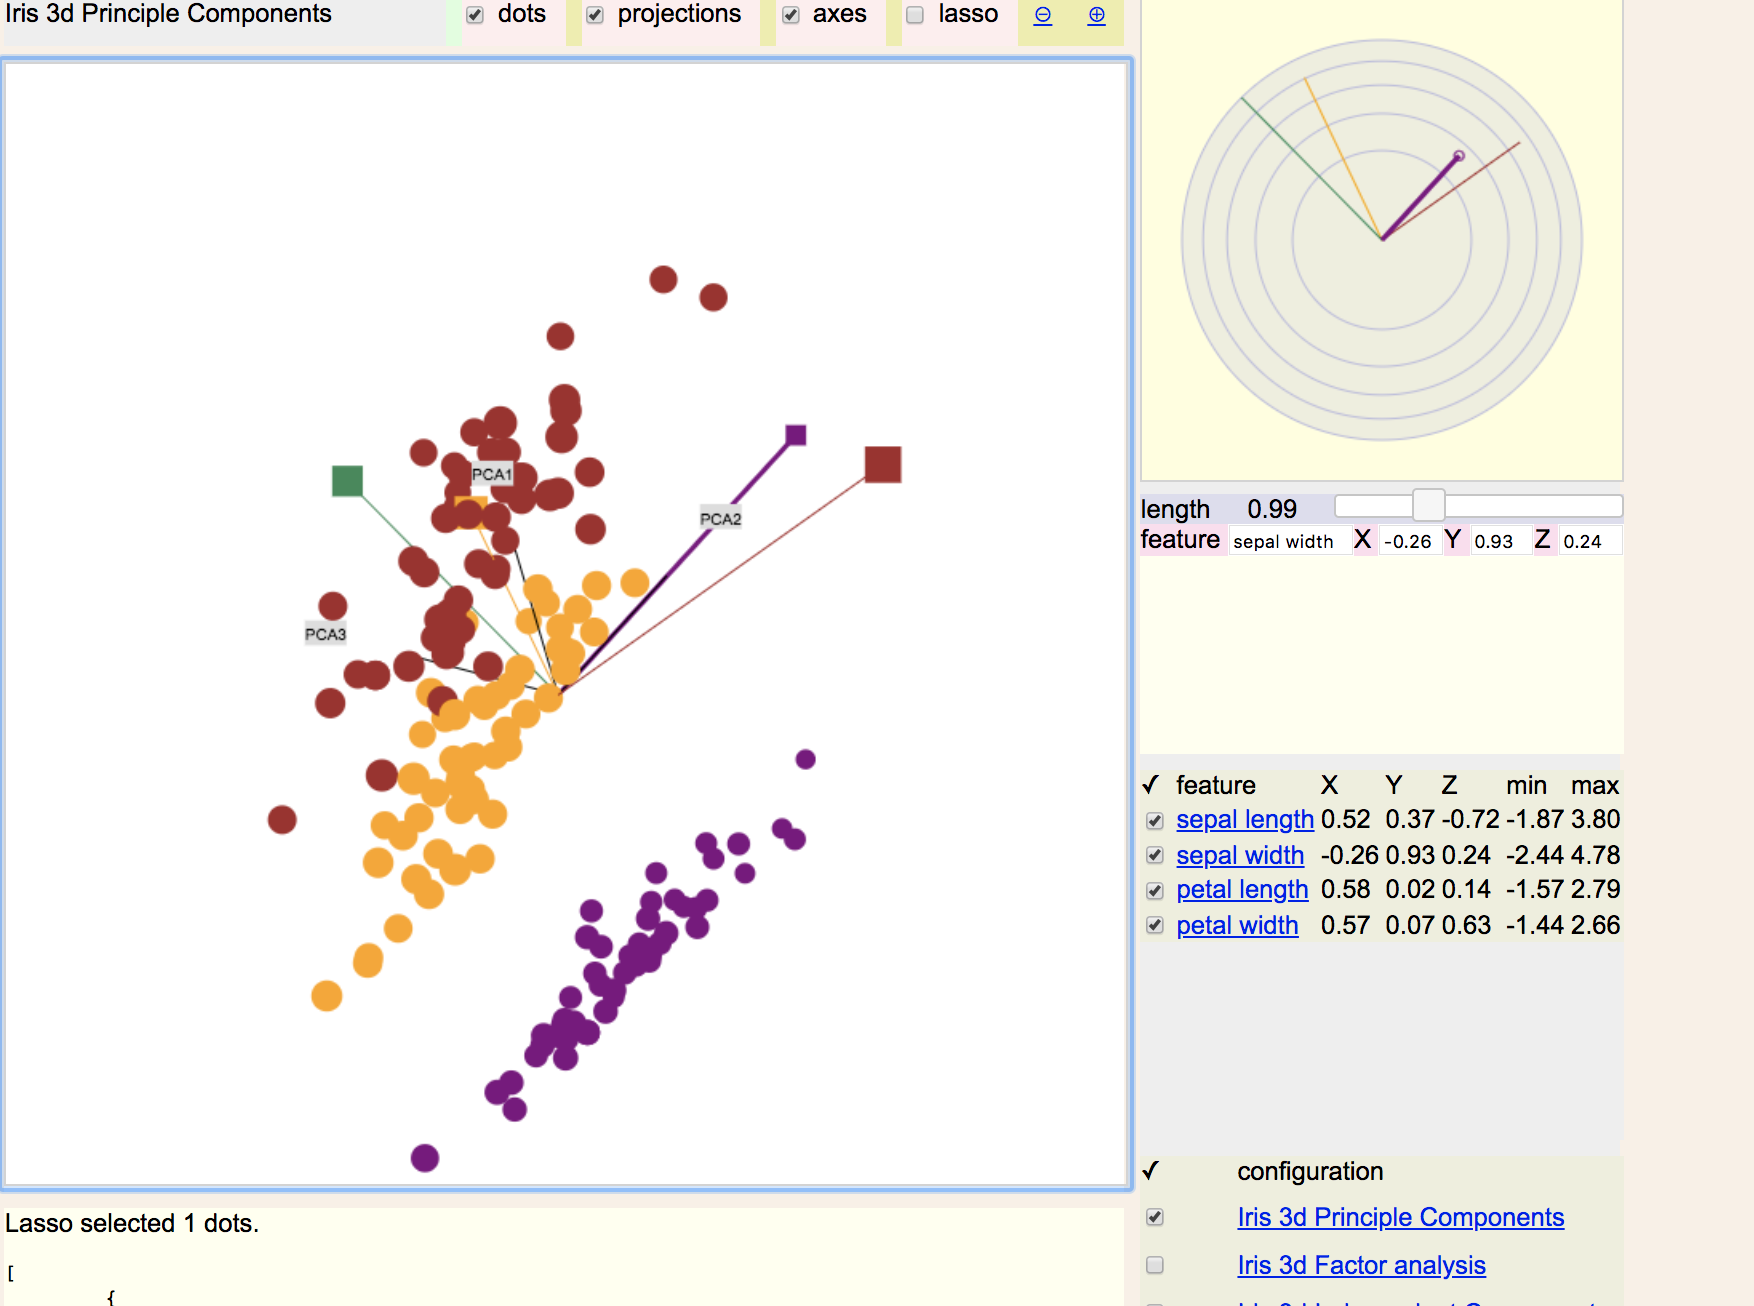
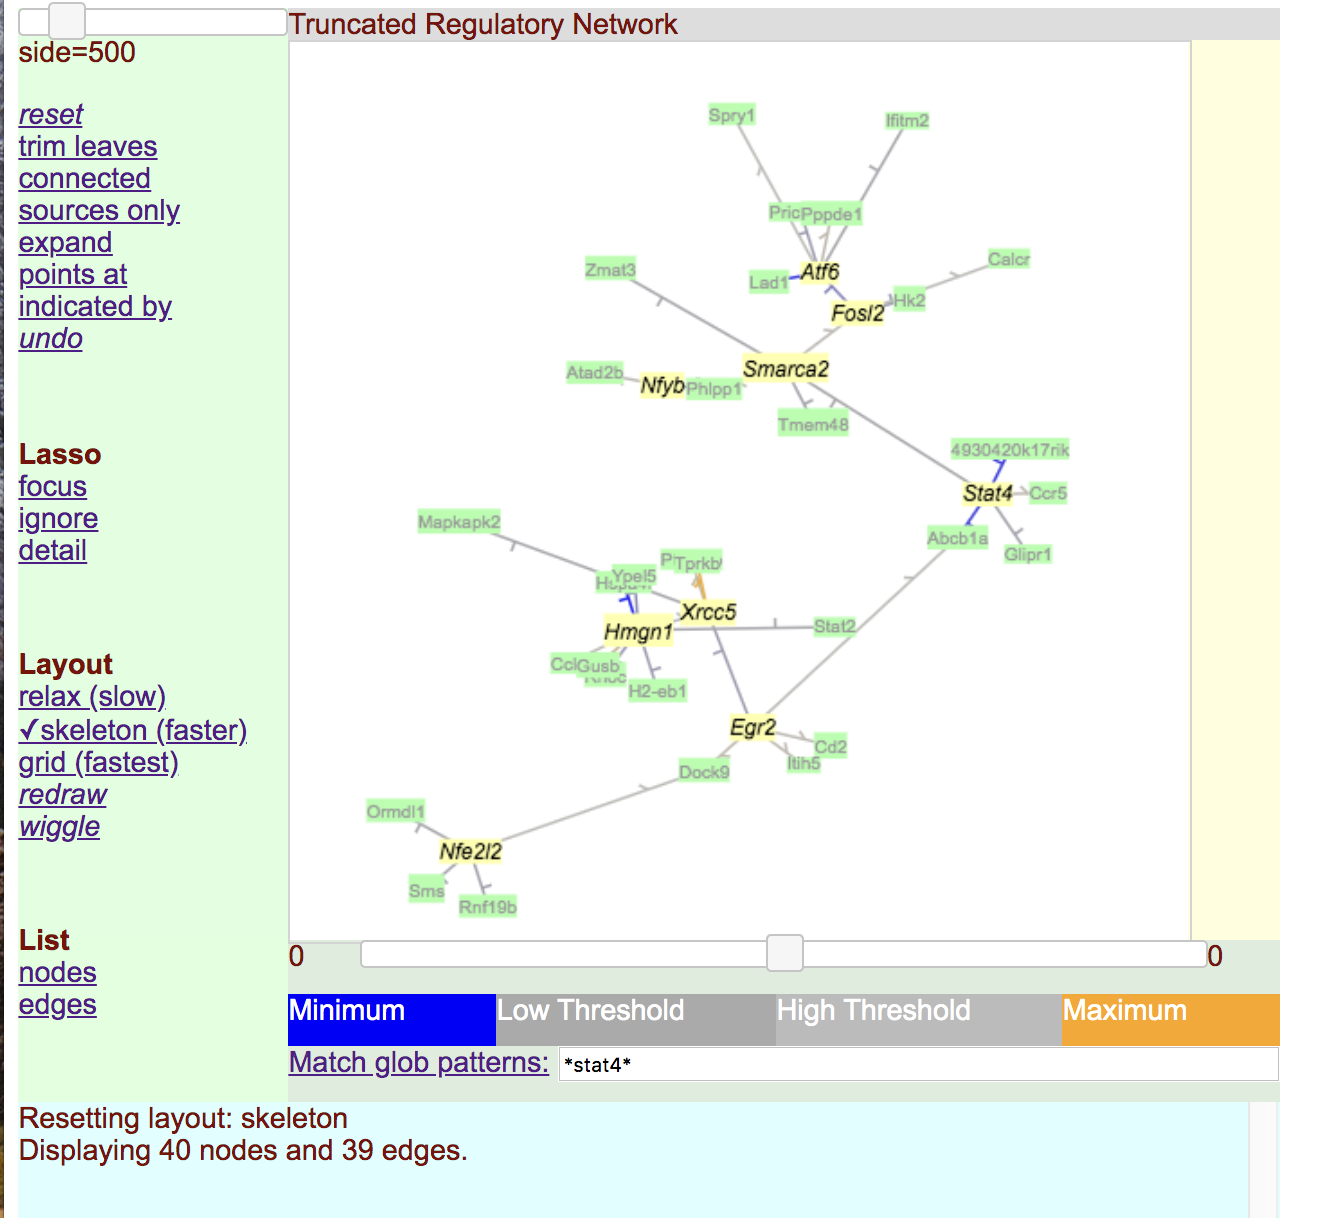
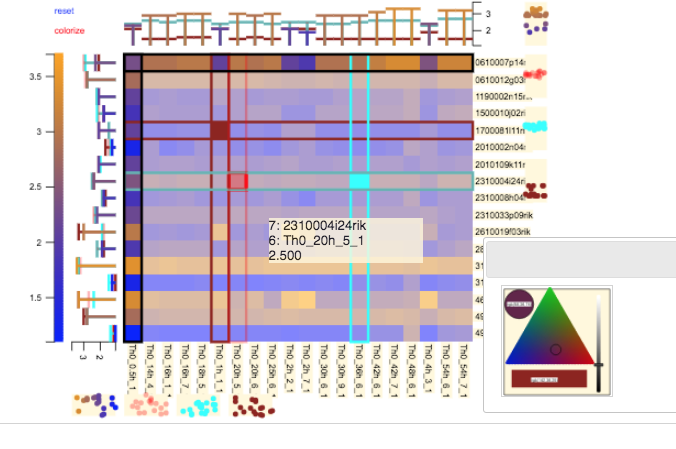
These example pages use stand alone Javascript, but the code used to implement them can be transliterated to Python and implemented using Jupyter widgets (modulo some subtleties).Multidimensional frames allow data to be projected from higher dimensions into 3 dimensions and then into 2 dimensions. the 3 dimensional representation can be rotated or otherwise animated before the presentation in 2 dimensions.
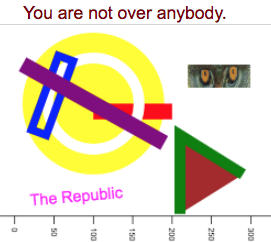
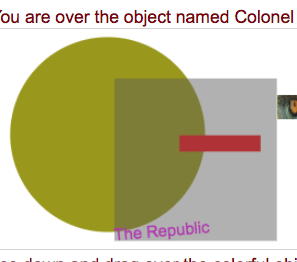
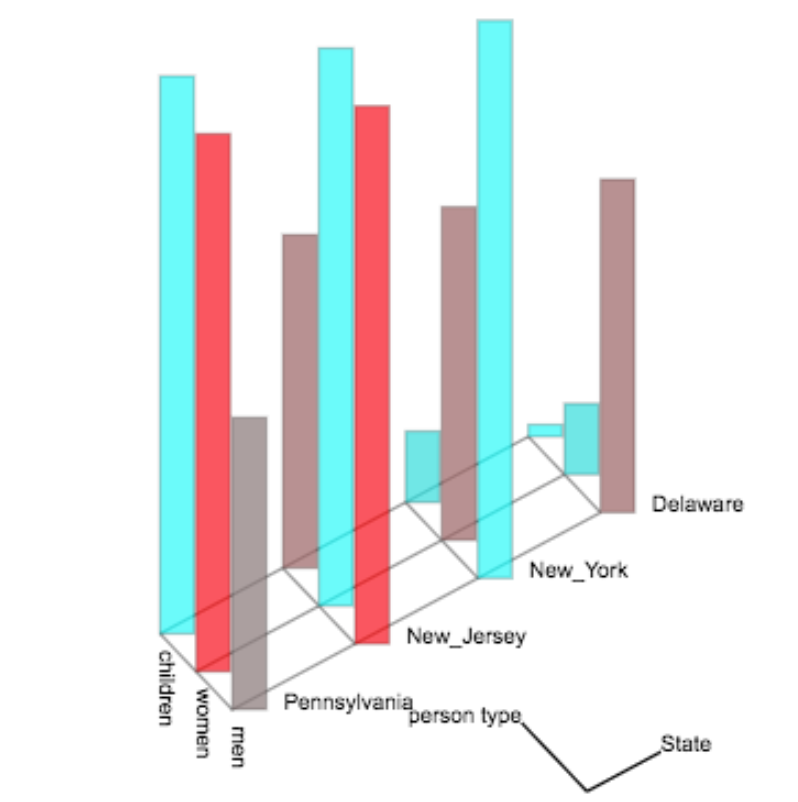
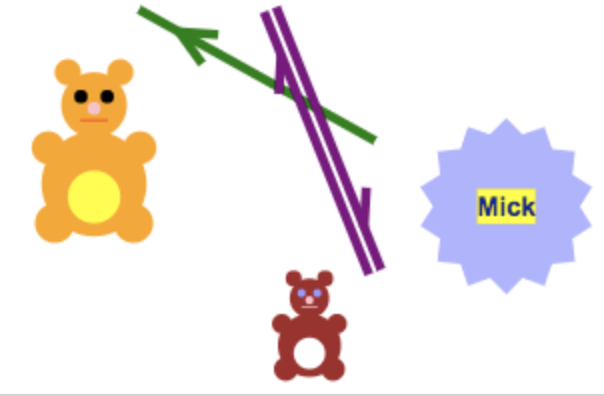
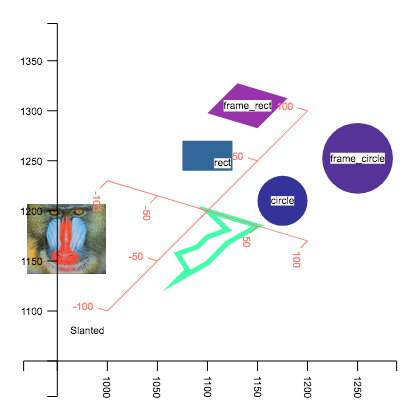
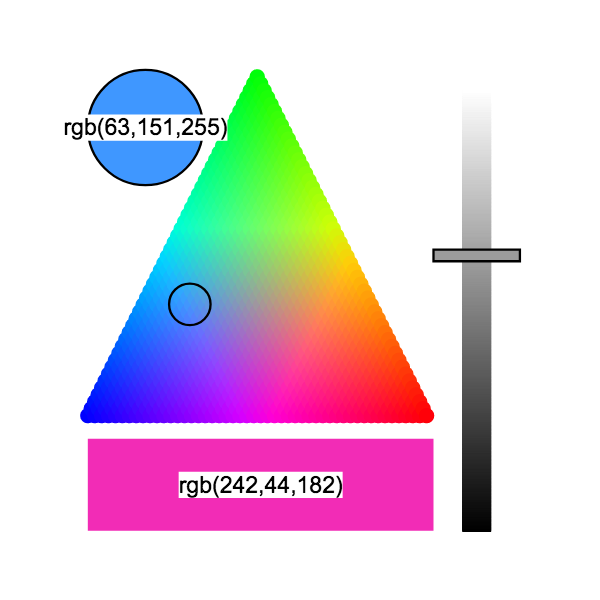
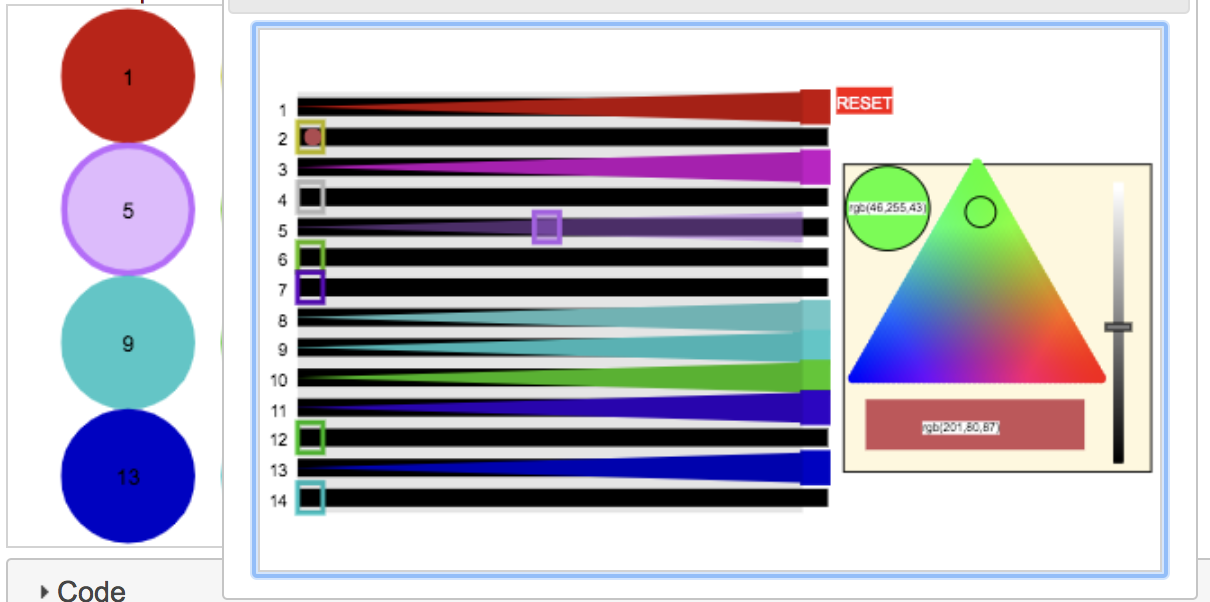
Below we draw elements with 3 dimensional coordinates. Drag the mouse on the figure to rotate the diagram. Shift-drag the mouse on the figure to translate the diagram.
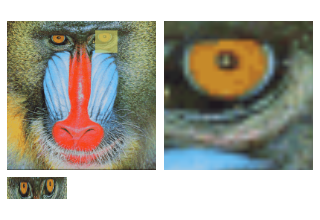
Note that the mandrill image does not rotate even though its location changes. Images, circles, rectangles and text are drawn using the 2 dimensional context.
This example shows data drawn in 3 dimensions, but the infrastructure allows objects to be drawn in more dimensions. Projection vectors define the translation of higher dimensions into the 3 and 2 dimensional contexts.