This is an example page for the
jp_doodle
package.
jp_doodle
makes implementing special purpose interactive visualizations easy.
Quick references: Javascript API; Python API.
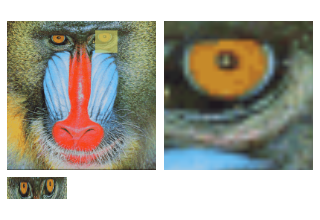
Miscellaneous Demos: Image detail viewer..
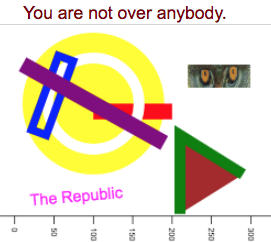
These example pages use stand alone Javascript, but the code used to implement them can be transliterated to Python and implemented using Jupyter widgets (modulo some subtleties).Dual canvasses provide a lasso feature which allows the user to select a group of named elements by encircling them with a polygonal "lasso".
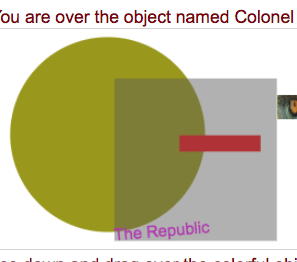
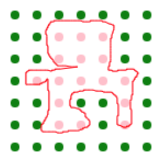
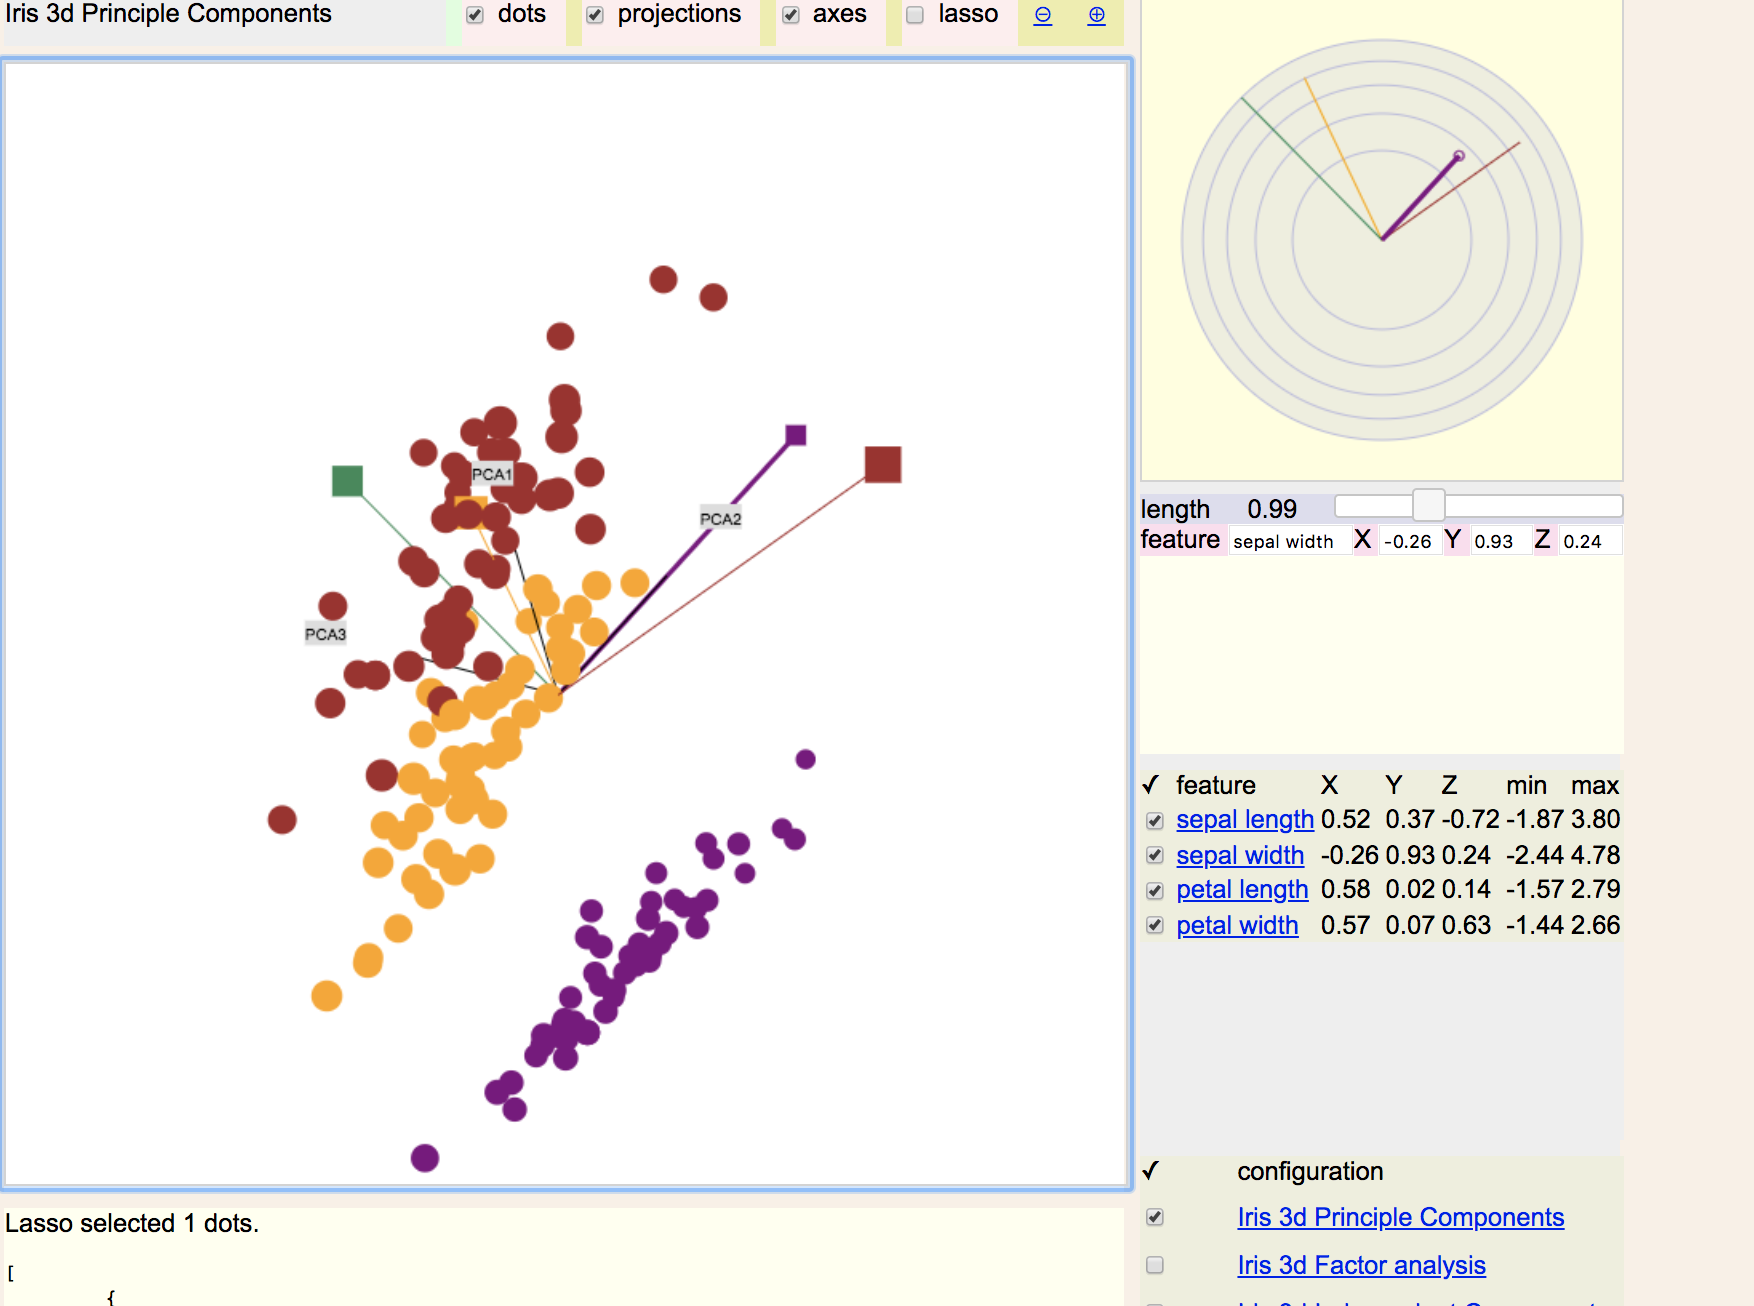
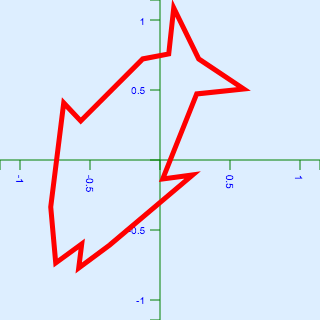
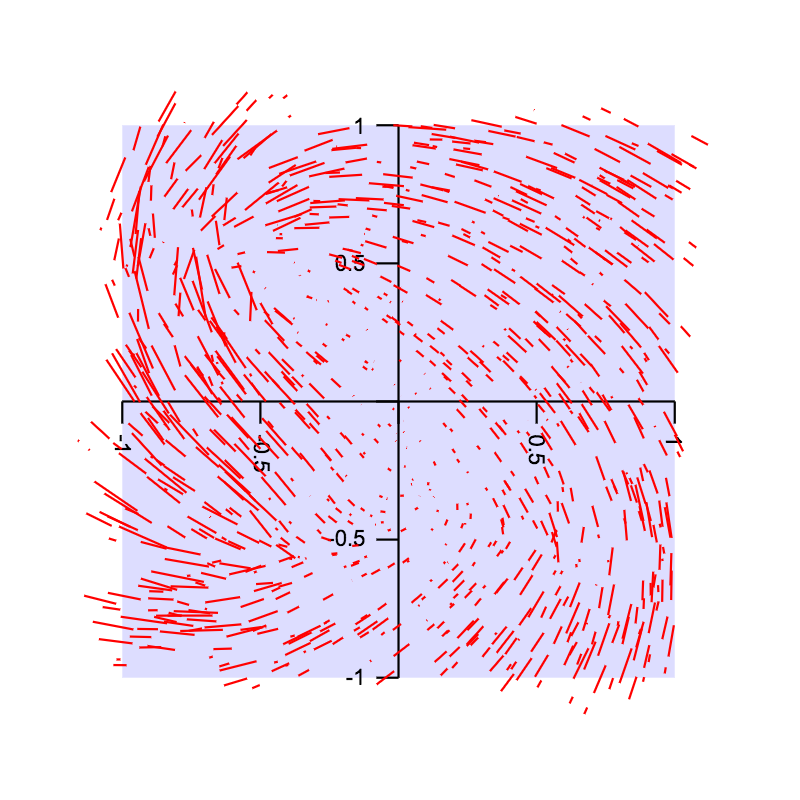
In this figure the user may mouse down to draw a polygon and mouse up to close the polygon. Selected circles in the lassoed area will turn from green to pink.
To surround some of the circles with a lasso selection polygon hold the mouse down in the figure and move the mouse around the circles of the selection. Release the mouse to close the polygon and trigger the lasso selection action.
When the lasso selection fires the callback function receives a mapping of selected object names to object properties. Objects that have not been named will not be selected by the lasso.
Click the reset button to change all the circles back to green and set up another lasso interaction.