dual_canvas Python quick reference.
This document is part of the
`jp_doodle` (https://github.com/AaronWatters/jp_doodle)
package.
It provides a quick reference
to using the dual_canvas object API in Python to build visualizations in
interactive Jupyter widgets.
The dual_canvas mechanism is designed to make it easy to develop special
purpose interactive scientific visualizations in Jupyter and other web contexts.
A dual_canvas widget built using the Python interface
can be used to build interactive and animated visualizations that live inside
a Jupyter IPython notebook document. Discussions below illustrate how to create a canvas widget, draw things on the
canvas, modify and animate elements of a canvas, and associate mouse event actions to elements of a
canvas, among other topics.
About this document: This document is an executable Jupyter notebook, or another document format
derived from the notebook. The next "code cell" imports external functionality used in the notebook.
In the following discussion
we use the eg.show(demo) helper to optionally embed an image into
this notebook in order to facilitate file format conversion. Please replace
this helper with display(demo) when you emulate these code fragments.
from jp_doodle import dual_canvas
from IPython.display import display

import qr_helper as eg    # some helpers and tricks for embedding images
eg.DO_EMBEDDINGS = False  # flag indicates whether to embed images in the notebook or not (for format conversions)
Part 1: Creating canvas widgets and frames in widgets and coordinates
To create and use the widgets you need to import the dual_canvas module in an IPython notebook
and you probably also will want to use IPython.display.display.
Creating a dual_canvas.DualCanvasWidget
A dual canvas is a space on the IPython notebook to draw on using
drawing operations specified using (x,y) coordinates.
A newly created dual canvas initially has width and height given in device pixels.
The dual_canvas.DualCanvasWidget
constructor may optionally specify a default font. The initial lower left corner is at (0,0)
and the upper right corner is at (width, height)
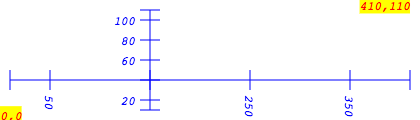
def make_a_canvas():

    # Create a canvas with pixel coordinates (0...420, 0...120)
    demo = dual_canvas.DualCanvasWidget(width=420, height=120, font="italic 12px Courier",)

    # Put some reference marks on the canvas to illustrate the coordinate space.
    demo.text(x=0, y=0, text="0,0", color="red", background="yellow", )
    demo.text(x=410, y=110, text="410,110", align="right", color="red", background="yellow", )
    demo.lower_left_axes(min_x=10, min_y=10, max_x=410,
                         max_y=110, x_anchor=150, y_anchor=40, max_tick_count=7, color="blue")
    eg.show(demo)  # replace with display(demo)

make_a_canvas()
Create a reference frame inside a dual canvas
Pixel coordinates are rarely the most convenient coordinate systems to
use for scientific visualizations. Reference frames allow drawing using
transformed coordinates. The frame_region method creates a frame
by mapping reference points in the pixel space to reference
points in the reference frame coordinate space. Objects can then
be drawn on the reference frame and the underlying coordinates will be
converted automatically.
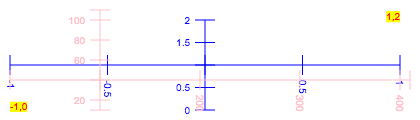
def make_a_reference_frame():
    demo = dual_canvas.DualCanvasWidget(width=420, height=120)

    # Map pixel coords (10,10) and (400,100)
    #  to frame coords (-1, 0) and (1, 2)
    frame = demo.frame_region(
        minx=10, miny=10, maxx=400, maxy=100,
        frame_minx=-1, frame_miny=0, frame_maxx=1, frame_maxy=2,
    )
    # Put some reference marks on the frame to indicate the coordinates.
    frame.text(x=-1, y=0, text="-1,0", color="red", background="yellow", )
    frame.text(x=1, y=2, text="1,2", align="right", color="red", background="yellow", )
    frame.lower_left_axes(min_x=-1, min_y=0, max_x=1,
                         max_y=2, x_anchor=0, y_anchor=1, max_tick_count=7, color="blue")

    # also draw axes in canvas/pixel coordinates
    demo.lower_left_axes(min_x=10, min_y=10, max_x=410,
                         max_y=110, x_anchor=100, y_anchor=40, max_tick_count=7, color="pink")
    eg.show(demo)  # replace with display(demo)

make_a_reference_frame()
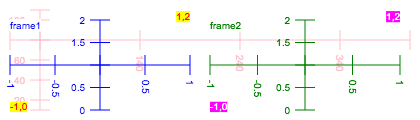
Create two reference frames inside a dual canvas
It is possible to create many reference frames inside a dual canvas each with a different coordinate transform.
def make_2_reference_frames():
    demo = dual_canvas.DualCanvasWidget(width=420, height=120)
    # draw pink axes in canvas/pixel coordinates behind the other figures.
    demo.lower_left_axes(min_x=10, min_y=10, max_x=410,
                         max_y=110, x_anchor=40, y_anchor=80, max_tick_count=7, color="pink")

    # Map pixel coords (10,10) and (190,100)
    #  to frame1 coords (-1, 0) and (1, 2)
    frame1 = demo.frame_region(
        minx=10, miny=10, maxx=190, maxy=100,
        frame_minx=-1, frame_miny=0, frame_maxx=1, frame_maxy=2,
    )
    # Put some reference marks on the frame1 to indicate the coordinates.
    frame1.text(x=-1, y=1.8, text="frame1", color="blue", background="white", )
    frame1.text(x=-1, y=0, text="-1,0", color="red", background="yellow", )
    frame1.text(x=1, y=2, text="1,2", align="right", color="red", background="yellow", )
    frame1.lower_left_axes(min_x=-1, min_y=0, max_x=1,
                         max_y=2, x_anchor=0, y_anchor=1, max_tick_count=7, color="blue")

    # Map pixel coords (210,10) and (400,100)
    #  to frame coords (-1, 0) and (1, 2)
    frame2 = demo.frame_region(
        minx=210, miny=10, maxx=400, maxy=100,
        frame_minx=-1, frame_miny=0, frame_maxx=1, frame_maxy=2,
    )
    # Put some reference marks on the frame2 to indicate the coordinates.
    frame2.text(x=-1, y=1.8, text="frame2", color="green", background="white", )
    frame2.text(x=-1, y=0, text="-1,0", color="white", background="magenta", )
    frame2.text(x=1, y=2, text="1,2", align="right", color="white", background="magenta", )
    frame2.lower_left_axes(min_x=-1, min_y=0, max_x=1,
                         max_y=2, x_anchor=0, y_anchor=1, max_tick_count=7, color="green")

    eg.show(demo)  # replace with display(demo)

make_2_reference_frames()
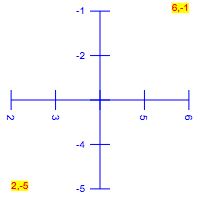
Get a simplified frame using swatch
The swatch convenience helper is useful to create square canvases with a single frame
where the X and Y coordinates have the same scale.
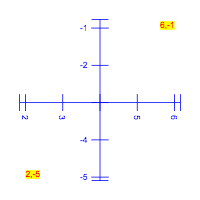
def make_a_swatch():

    # Create a frame with pixel coordinates 200 by 200 using swatch:
    frame = dual_canvas.swatch(
        pixels=200,       # width and height of 200 pixels
        model_height=4.5, # width and height in frame coordinates
        cx=4,
        cy=-3,            # center of canvas at (4, -3) in frame coordinates (default (0, 0))
        snapfile=None,    # if this is set to a file path the widget will be a snapshot widget (default None)
        show=False,       # automatically display the widget if true (default True)
    )
    # Put some reference marks on the canvas to indicate the coordinates.
    frame.text(x=2, y=-5, text="2,-5", color="red", background="yellow", )
    frame.text(x=6, y=-1, text="6,-1", align="right", color="red", background="yellow", )
    frame.lower_left_axes(min_x=2, min_y=-5, max_x=6,
                         max_y=-1, x_anchor=4, y_anchor=-3, max_tick_count=7, color="blue")
    eg.show(frame)  # replace with display(frame)

make_a_swatch()
The return value for swatch is a reference frame. The underlying canvas widget associated
with the frame is available as frame.get_canvas().
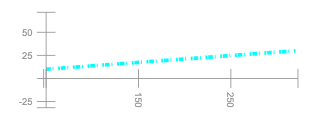
Simplified coordinates using the fit() method
It is often convenient to draw objects on a canvas or frame and then use the fit method to automatically
adjust the coordinate conversions so the visible objects are visible in the frame. Fit will compute the
maximum and minimum coordinate values drawn and automatically adjust the canvas coordinate conversion
so that the objects are in view and "fill" the canvas in either the X or Y dimension (or both).
Warning: Buggy code that uses fit() may make objects that are so far apart
that they are too small to be seen after the fit() operation.
Note: Below we do not explicitly choose the center of the frame or the
endpoints of the axes because they are derived from the coordinate system
chosen by fit automatically.
def fit_a_swatch():

    # Create a canvas with pixel coordinates 200 by 200 using swatch:
    #   Note: we don't specify the center because fit() below will chose the appropriate center.
    frame = dual_canvas.swatch(200, 4.5, show=False)
    # Put some reference marks on the canvas to indicate the coordinates.
    frame.text(x=2, y=-5, text="2,-5", color="red", background="yellow", )
    frame.text(x=6, y=-1, text="6,-1", align="right", color="red", background="yellow", )
    # fit the text objects into the canvas
    frame.fit()

    # Draw axes using the coordinate system chosen by the fit operation above
    #   Note: the max and min coordinates are not specified because they are inferred from the fit.
    frame.lower_left_axes(max_tick_count=5, x_anchor=4, y_anchor=-3, color="blue")

    # Fit the objects drawn into the canvas again allowing a margin of 20 pixels
    frame.fit(margin=20)
    eg.show(frame)  # replace with display(frame)

fit_a_swatch()
1.6 Create a "Snapshot canvas"
widget = dual_canvas.SnapshotCanvas(filename="snapshot_image_file.png", width=420, height=120)
widget.display_all()  # Show the canvas inside the snapshot tab.
Part 2: Drawing on canvases and frames
Dual canvases and reference frames on dual canvases support a number of drawing operations described below.
The discussion makes use of the helper module to present the draw operations and their visual results shown with a reference axis without having to repeat boilerplate code (like creating a canvas and an axis over and over and over....).
Objects may be drawn directly using the canvas (in which case the canvas is also the reference frame) or with respect to a reference frame derived from the canvas.
Note that some objects (text, circle, and, rect) are sized relative to the
canvas, not relative to any reference frame, in order to allow consistent mark sizes
across all frames of a canvas. The frame_rect and frame_circle variants
are sized relative to the current frame. All objects are positioned relative
to the current frame,
eg.py_line_example()
eg.py_arrow_example()
eg.py_double_arrow_example()
eg.py_polyline_example()
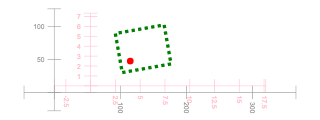
eg.py_polygon_example()
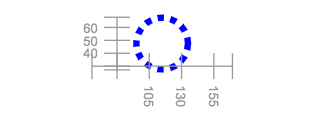
eg.py_circle_example()
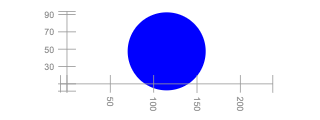
eg.py_frame_circle_example()
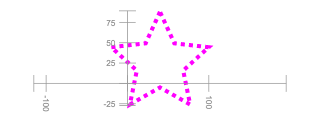
eg.py_star_example()
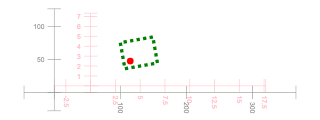
eg.py_rect_example()
eg.py_canvas_rect_example()
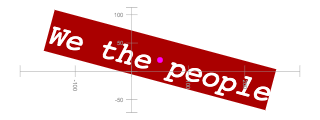
eg.py_text_example()
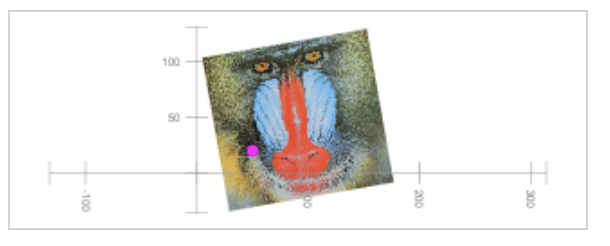
eg.py_full_image_example()
Note: The canvas created above is marked "tainted" because it loads an image from a remote origin and security restrictions in the browser prevent the canvas from being converted to an image. Here is a screen capture of the live canvas when executed:
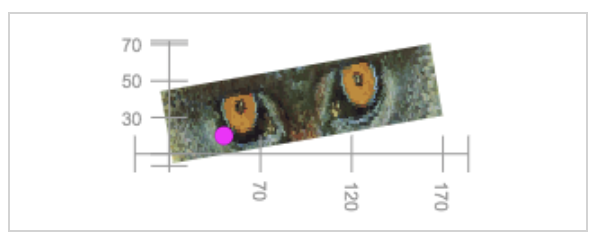
eg.py_part_image_example()
Note: The canvas created above is marked "tainted" because it loads an image from a remote origin and security restrictions in the browser prevent the canvas from being converted to an image. Here is a screen capture of the live canvas when executed:
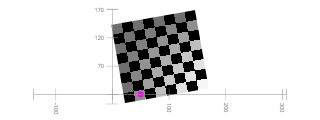
eg.py_bw_image_example()
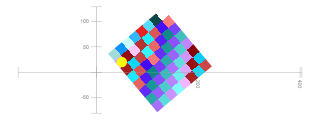
eg.py_color_image_example()
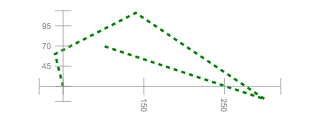
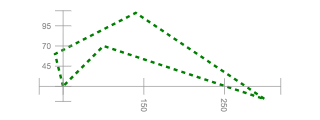
Drawing axes
The left_axis, right_axis, bottom_axis, top_axis, and lower_left_axis methods
draw axes on the canvas.
def axes_demos():
    widget = dual_canvas.DualCanvasWidget(width=420, height=120, font="italic 12px Courier",)

    widget.left_axis(
        min_value=10,
        max_value=80,
        axis_origin=dict(x=40, y=0),
        max_tick_count=3,
        color="green",
        add_end_points=True
    )
    widget.right_axis(
        min_value=10,
        max_value=80,
        axis_origin=dict(x=240, y=0),
        max_tick_count=7,
        color="red"
    )
    widget.bottom_axis(
        min_value=60,
        max_value=110,
        axis_origin=dict(x=0, y=20),
        max_tick_count=5,
        color="blue"
    )
    widget.top_axis(
        min_value=130,
        max_value=180,
        axis_origin=dict(x=0, y=100),
        max_tick_count=5,
        color="orange"
    )

    widget.lower_left_axes(
        min_x=50,
        min_y=30,
        max_x=210,
        max_y=90,
        x_anchor=130,
        y_anchor=66,
        max_tick_count=4,
        color="brown")

    widget.fit(margin=10)
    eg.show(widget)  # replace with display(demo)

axes_demos()

Part 3: Events and mutations
Objects which have been explicitly named can be changed (moved, resized, deleted, transitioned, etcetera) and unless events are disabled for the object the object can respond to mouse events (mouse over, click, etcetera).
Attaching event callbacks
The object.on(etype, callback)
attaches a callback to be called when the object
recieves an event of type etype.
def py_event_example():
    widget = dual_canvas.DualCanvasWidget(width=120, height=120)

    # this circle cannot be mutated and does not respond to events because it is not named.
    widget.circle(x=0, y=0, r=100, color="#e99")

    # this text is named and can be mutated and can respond to events
    txt1 = widget.text(x=0, y=0, text="Click me please", degrees=45, name=True,
               font= "40pt Arial", color="#e3e", background="#9e9", align="center", valign="center")

    # add a click event bound to the txt which transitions the text rotation
    def on_click(*ignored):
        txt1.transition(text="That tickles", degrees=720, color="#f90", background="#009", seconds_duration=5)

    txt1.on("click", on_click)

    widget.fit()
    eg.show(widget)  # replace with display(demo)

py_event_example()

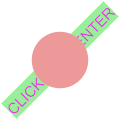
Unnamed objects are invisible to events
If an object is not named it will not respond to events
but a named object drawn undernieth the unnamed object may
receive the event.
A named object may also disable events by setting events=False
-- the resulting object can be changed or deleted but it will not respond to events:
widget.circle(x=0, y=0, r=100, color="#e99", name=True, events=False)
Below the circle obscures the text but clicks in the center of the circle are recieved by the text.
def py_no_name_no_event():
    widget = dual_canvas.DualCanvasWidget(width=120, height=120)

    # this text is named and can be mutated and can respond to events
    txt2 = widget.text(x=0, y=0, text="CLICK THE CENTER", degrees=45, name=True,
               font= "40pt Arial", color="#E3E", background="#9e9", align="center", valign="center")

    # this circle cannot be mutated and does not respond to events because it is not named.
    # Clicks on the circle above the underlying text will propagate to the text object.
    widget.circle(x=0, y=0, r=100, color="#e99")

    # add a click event bound to the txt which transitions the text rotation
    def on_click(*ignored):
        txt2.transition(text="That tickles", degrees=720, color="#f90", background="#009", seconds_duration=5)

    txt2.on("click", on_click)

    widget.fit()
    eg.show(widget)  # replace with display(demo)

py_no_name_no_event()
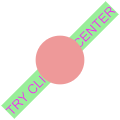
Only the top named object responds to events
Only the top named object under an event receives the event even if it is drawn using a transparent color. Any object underneith the top object will not receive the event.
def py_top_object_event():
    widget = dual_canvas.DualCanvasWidget(width=120, height=120)

    # this text is named and can be mutated and can respond to events
    txt3 = widget.text(x=0, y=0, text="TRY CLICKING CENTER", degrees=45, name=True,
               font= "40pt Arial", color="#E3E", background="#9e9", align="center", valign="center")

    # this circle CAN be mutated and DOES respond to events because it is named.
    # and clicks on the circle will NOT "propagate" to the text object underneith.
    circ3 = widget.circle(x=0, y=0, r=100, color="#e99",
                 name=True)

    # add a click event bound to the txt which transitions the text rotation
    def on_click(*ignored):
        txt3.transition(text="That tickles", degrees=720, color="#f90", background="#009", seconds_duration=5)
        circ3.change(color="red")

    txt3.on("click", on_click)

    widget.fit()
    eg.show(widget)  # replace with display(demo)

py_top_object_event()
Changing, transitioning, forgetting, and hiding named objects
Named objects have methods which allow them to be modified or related to interactive events.
# Change the object options.
object.change(**changed_options)

# Transition the object options over a time period.
object.transition(seconds_duration, **changed_options)

# Make the object invisible and unresponsive to events
object.visible(False)

# Make the object visible and enable event bindings.
object.visible(True)

# Remove the object from the canvas and dispose of it.
object.forget()
Binding and unbinding event callbacks to named objects
# Attach an event handler to call when event_type effects the object.
object.on(event_type, handler)

# Detach any event handler associated with event_type for the object.
object.off(event_type)
Event types include click, mousedown, mouseup, mouseout, mouseover, mousemove, keydown
among others. Please see
https://developer.mozilla.org/en-US/docs/Web/Events
and https://api.jquery.com/on/
for more information about events.
Addressing objects by name
Objects can be identified by name and modified using methods attached to the canvas widget.
# Change object properties by object name.
canvas.change(name, **changed_options)

# Destroy objects with a sequence of names.
canvas.forget_objects(names)

# Show or hide objects identified by a name sequence.
canvas.set_visibilities(names, visibility)

# Add an event binding to an object by name or the whole canvas if for_name is None.
canvas.on_canvas_event(event_type, callback, for_name=None, abbreviated=True, delay=True)

# Remove an event binding from an object by name or from the whole canvas if for_name is None.
canvas.off_canvas_event(event_type, for_name=None)
The event callback
Event callbacks receive a dictionary argument event describing the event.
Descriptive slots include:
event["type"]gives the type of the event (likeclick).event["canvas_name"]give the name of the object under the event, if any (some events are associated to the canvas and have no target object on the canvas).event["model_location"]gives the coordinate position on the canvas or reference frame associated with the event as a dictionary like{'x': -0.21, 'y': 0.28}.event["reference_frame"]["name"]gives the name of the reference frame for the canvas if the event is associated with a reference frame.
event = None

def event_callback_example():
    widget = dual_canvas.DualCanvasWidget(width=220, height=220)

    frame = widget.frame_region(
        minx=10, miny=10, maxx=200, maxy=200,
        frame_minx=-1, frame_miny=-1, frame_maxx=1, frame_maxy=1,
        name="EVENT_REFERENCE_FRAME"
    )
    frame.lower_left_axes(min_x=-1, min_y=-1, max_x=1, max_y=1, color="pink", max_tick_count=4)
    txte = frame.text(-0.5, 0.25, "CLICK ME", name="EVENT_EXAMPLE_TEXT", background="#eea")

    def callback(e):
        global event
        event = e
        txte.change(text="Thanks!", background="#aee")

    txte.on("click", callback)

    eg.show(widget)  # replace with display(demo)

event_callback_example()
if event is None:
    print("The object has not been clicked")
else:
    print("The event was of type", event["type"])
    print("Clicked object named", event["canvas_name"])
    print("Click was positioned in the reference frame coordinates at", event["model_location"])
    print("The reference frame for the click was named", event["reference_frame"]["name"])
#event
When the previous cell runs after the txte object is clicked the cell prints eomething similar to the following:
The event was of type click
Clicked object named EVENT_EXAMPLE_TEXT
Click was positioned in the reference frame coordinates at {'x': -0.2302634791324013, 'y': 0.2726244474712171}
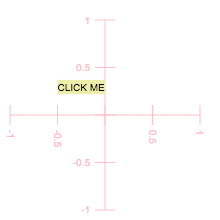
The reference frame for the click was named EVENT_REFERENCE_FRAMESelecting named objects by surrounding them with a lasso
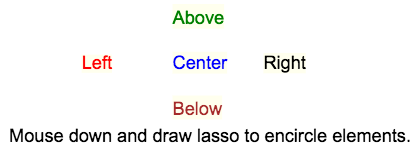
The widget.do_lasso(callback) method allows the user to select named objects
by surrounding them with a graphical loop. After the loop is complete the callback
receives a dictionary mapping the names of the selected objects to their descriptions.
mapping = None

widget = dual_canvas.DualCanvasWidget(width=420, height=150)

def py_lasso_demo():
    info = widget.text(10, 10, "Mouse down and draw lasso to encircle elements.", name="info")
    left = widget.text(50, 50, "Left", name="left", background="#ffe", color="red")
    center = widget.text(100, 50, "Center", name="center", background="#ffe", color="blue")
    above = widget.text(100, 75, "Above", name="above", background="#ffe", color="green")
    below = widget.text(100, 25, "Below", name="below", background="#ffe", color="brown")
    right = widget.text(150, 50, "Right", name="right", background="#ffe")

    def callback(m):
        global mapping
        mapping = m
        info.change(text="selected: " + str(list(mapping.keys())) + ". Play again!")
        # set up the lasso again
        widget.do_lasso(callback)

    widget.fit()

    widget.do_lasso(callback)

    eg.show(widget)  # replace with display(demo)

py_lasso_demo()
if mapping is None:
    print ("Lasso was not completed.")
else:
    print ("Lassoed", len(mapping), "objects.")
    for name in mapping:
        info = mapping[name]
        print("   name:", name, "at", info["x"], info["y"], "shape", info["shape_name"], "color", info["color"])
After encircling "Above" and "Center" the cell above prints
Lassoed 2 objects.
name: above at 100 75 shape text color green
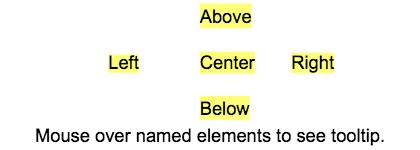
name: center at 100 50 shape text color blueAdding a floating tooltip for named elements
The widget.enable_tooltip(tooltip_attribute="tip", background="cyan")
causes named objects to pop up a tooltip showing the value of the
tip attribute when the mouse is over the object.
def py_tooltip_demo():
    widget = dual_canvas.DualCanvasWidget(width=420, height=150)

    info = widget.text(10, 10, "Mouse over named elements to see tooltip.", tip="this unnamed element will not respond!")
    left = widget.text(50, 50, "Left", name="left", background="#ff7", tip="the left most <br> named element")
    center = widget.text(100, 50, "Center", name="center", background="#ff7", tip="the central <br> named element")
    above = widget.text(100, 75, "Above", name="above", background="#ff7", tip="the upper most <br> named element")
    below = widget.text(100, 25, "Below", name="below", background="#ff7", tip="the lower most <br> named element")
    right = widget.text(150, 50, "Right", name="right", background="#ff7", tip="the right most <br> named element")

    widget.fit()

    widget.enable_tooltip(tooltip_attribute="tip", background="cyan", font="bold 10px Arial")
    widget.element.jp_doodle_tooltip.css({"border-radius": "5px", "padding": "4px"})

    eg.show(widget)  # replace with display(demo)

py_tooltip_demo()
Part 4: Other canvas and frame methods
Preventing redraws during complex updates.
# Do not redraw the widget until both update operations are complete.
with widget.delay_redraw():
    complex_update1(widget)
    complex_update2(widget)
Remove all objects and reset internal data structures
The following will remove and destroy all objects from a canvas and reset the canvas to its initial configuration.
widget.reset_canvas()
The following will remove and destroy all objects from a canvas and reset a frame to its initial configuration.
frame.reset_frame()
Pop out dialog
The in_dialog method places the canvas in a floating JQueryUI dialog.
widget.in_dialog()
Execute callback at next animation frame
The requestAnimationFrame method calls the
callback when the screen refreshes.
widget.requestAnimationFrame(callback)
Recalibrate a frame
The following will reposition and rescale a frame
frame.set_region(
    minx, miny, maxx, maxy,
    frame_minx, frame_miny, frame_maxx, frame_maxy)
Show debug output area
The widget.debugging_display() method generates a composite widget
which provides verbose debugging information that may provide information
about exceptions or other problems which occur during the development
of a canvas viaualization.
widget.debugging_display()