This is an example page for the
jp_doodle
package.
jp_doodle
makes implementing special purpose interactive visualizations easy.
Quick references: Javascript API; Python API.
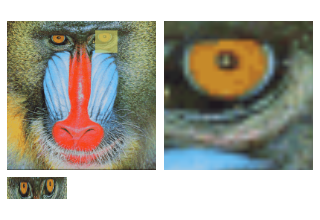
Miscellaneous Demos: Image detail viewer..
These example pages use stand alone Javascript, but the code used to implement them can be transliterated to Python and implemented using Jupyter widgets (modulo some subtleties).
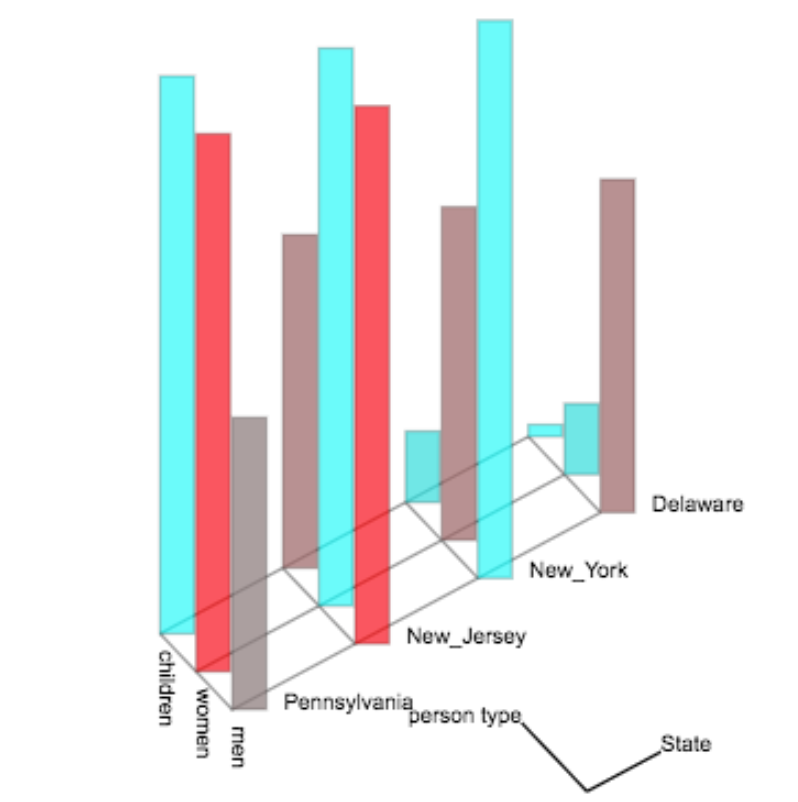
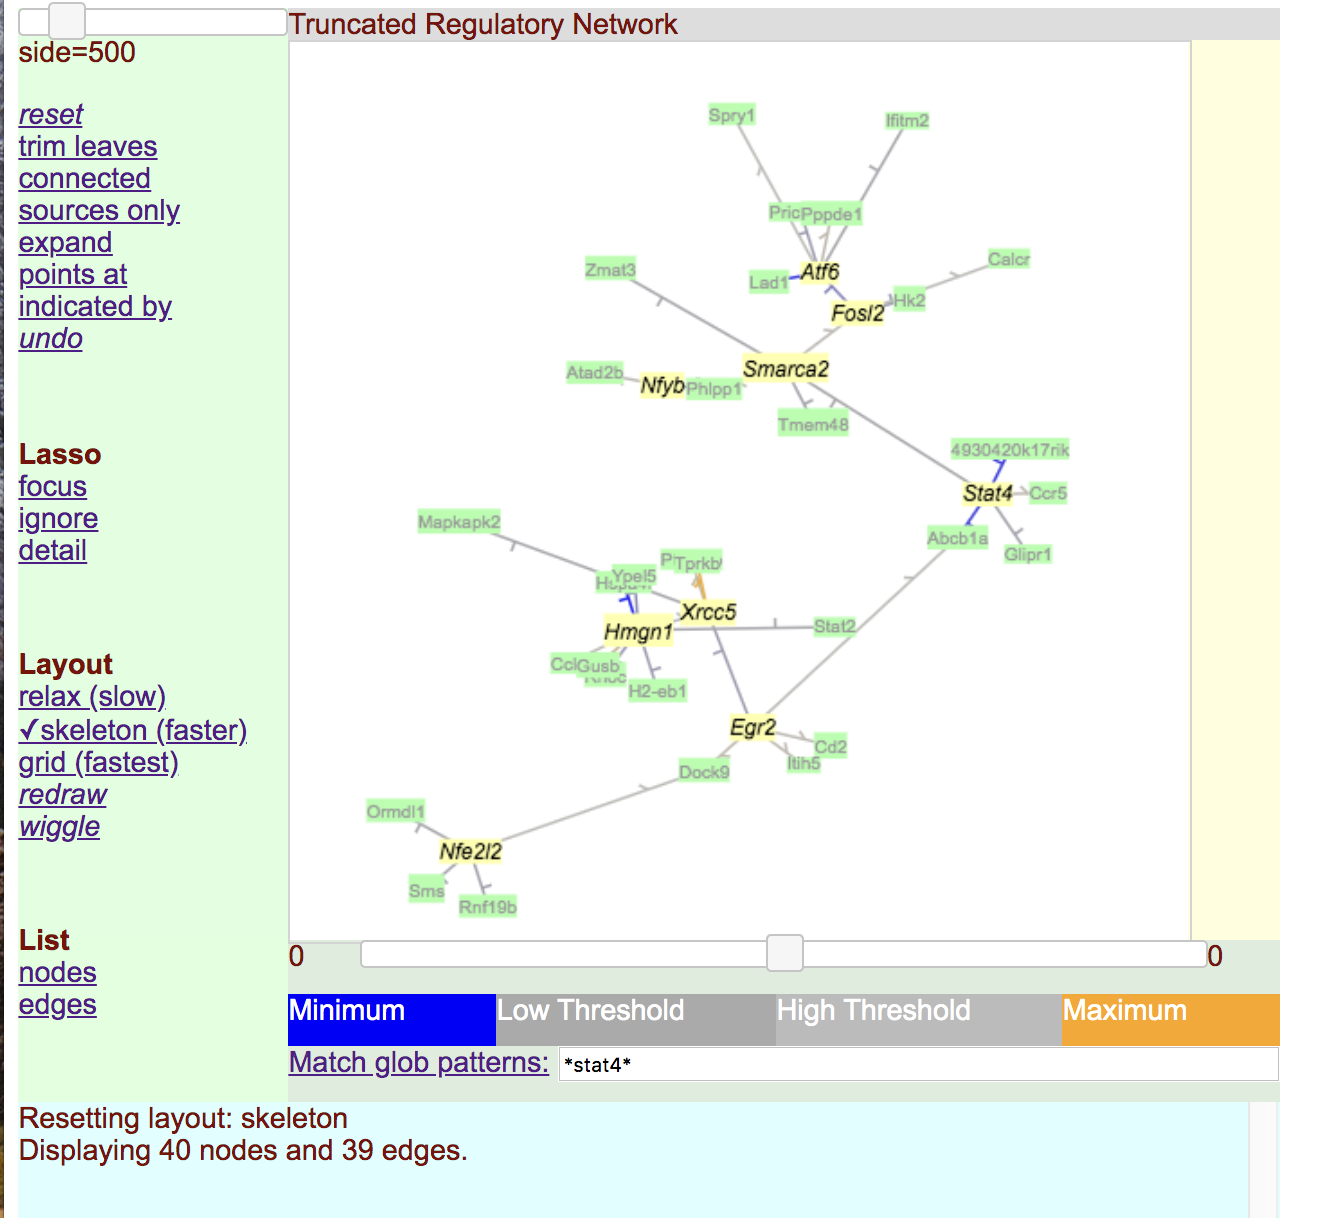
The rectangle_collection.js plugin provides
an experimental implementation of a two category bar chart.
This proof of concept is useful as an example of a complex
component built using jp_doodle.
Click "person type" or "State" to start and stop adjusting the layout of the barchart. Mouse over the rectangles and other labels for detail information.
The `rectangles_collection` proof of concept implementation provides an extended example of how to use dual canvases to build more complex visualizations. It includes mouse event handling, object hiding, dynamic layout adjustment, and a floating dialog.